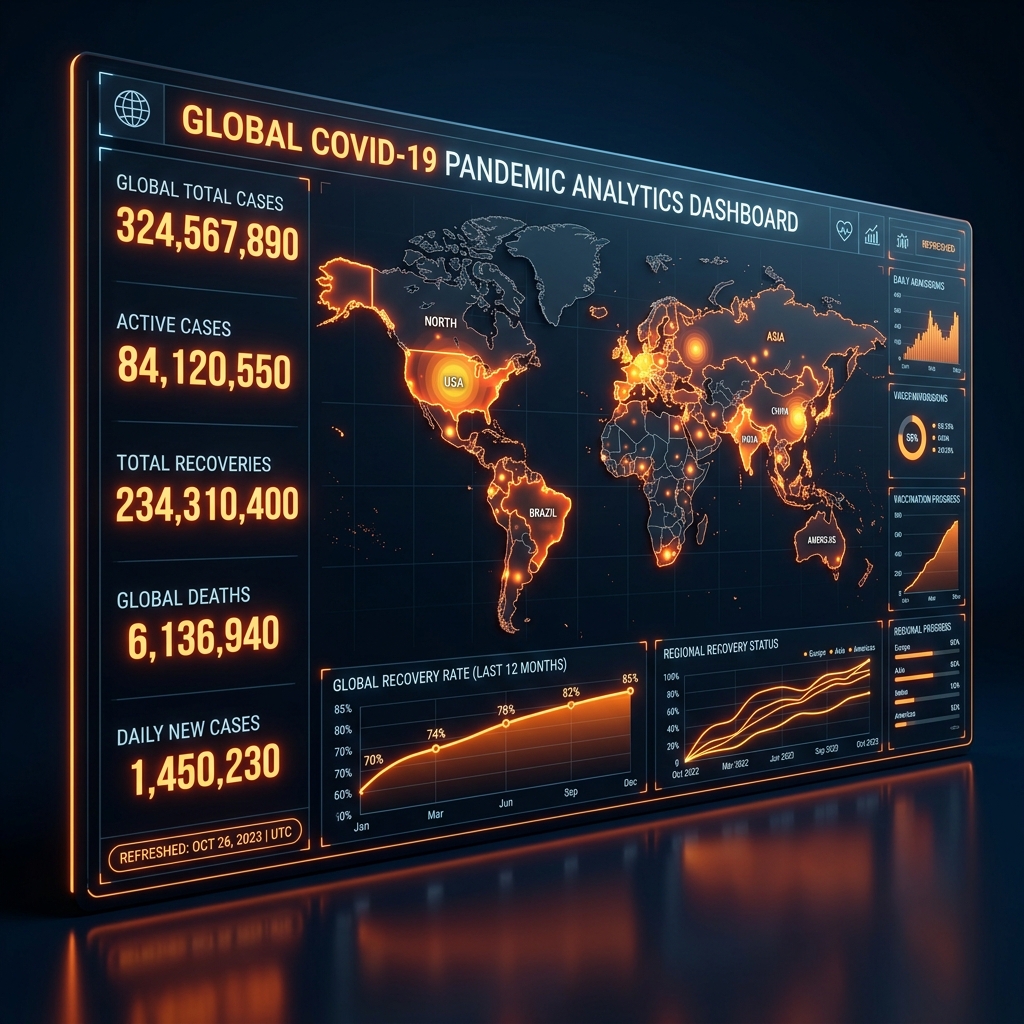
Case Study Overview
Exploring global transmission rates, recovery rates, and regional hotspots during different waves of the COVID-19 pandemic to assist policy analysis and health research.
Problem Statement
Analyze global COVID-19 trends to understand infection spreads and identify critical zones requiring medical aid or containment.
Analytical Focus
Processing, merging, and cleaning massive CSV and JSON transactional datasets containing infection records and hospital charts.
The Analytical Approach
Using Python libraries like Pandas and NumPy, I consolidated global data from John Hopkins University, fixed formatting anomalies, and structured tables for efficient database load.
The cleansed tables were then imported to Tableau, establishing data relationships and producing spatial layouts to observe changes over time.
Results & Business Value
Key Metric Improvement
Actionable Global Insights Generated
- Delivered a central portal showing recovery rates by country and demographic group.
- Highlighted regression charts tracking vaccine delivery against hospital admissions.
- Created dynamic heatmaps mapping positive rate surges in real time.