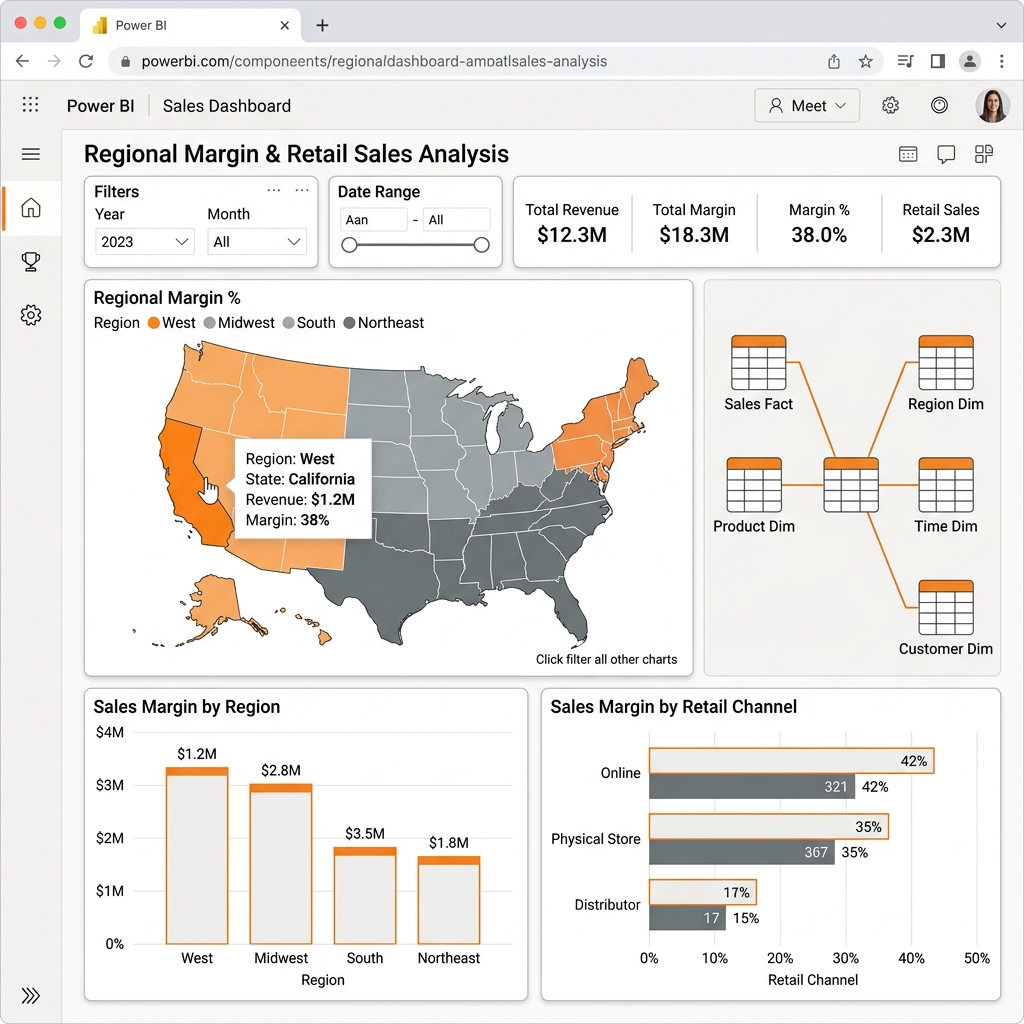
Case Study Overview
Consolidating disjointed weekly sales records from retail branches and third-party distributors into a single source of truth dashboard.
Problem Statement
Unify reporting metrics across branches to eliminate manual spreadsheet consolidation and reporting delays.
Analytical Focus
Formulating Power Query transformations, setting star-schema relational tables, and engineering DAX measures.
The Analytical Approach
I led technical requirements workshops to define critical KPIs (e.g. Month-on-Month Growth, Average Order Value, Customer Acquisition Costs). I then connected Power BI to central databases and cleaned files using Power Query.
I created relational models using a calendar dimension table, allowing stakeholders to easily filter trends by week, region, or product lines.
Results & Business Value
Key Metric Improvement
8 Hours Saved Weekly per Manager
- Automated sales tracking, completely removing manual Excel data entry errors.
- Provided region directors with daily insight into product margins, improving inventory turnover.
- Enabled interactive filters that let executives drill down from country levels to specific product categories.